
The Nasdaq 100 index fell by more than -13% in April. Is it time to buy or to wait a little longer before buying the dip?
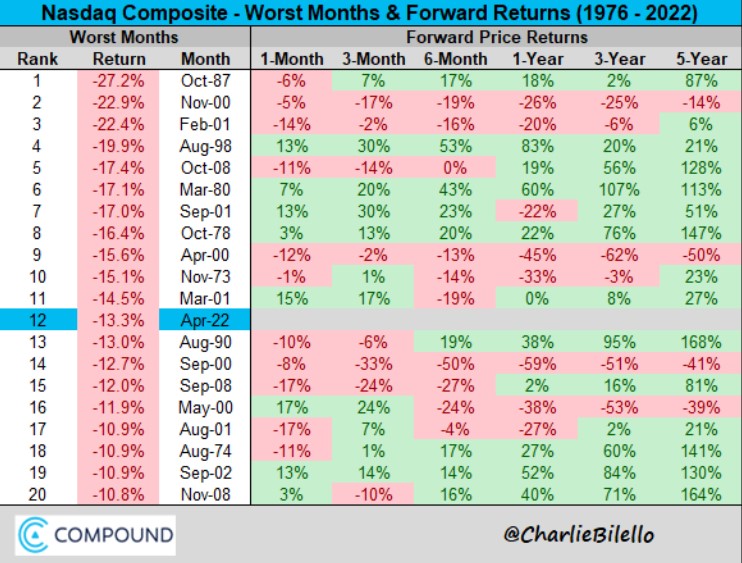
April marked one of the sharpest declines in the Nasdaq 100’s history. More precisely, the so-called tech index dropped by -13.3% in the previous month, making it the 12th worth month in history.
That is the bad news.
The good news is that after such declines, the market had bounced strongly in the past. For instance, in August 1990, the tech index dropped by -13%.
But six months later, it delivered a 19% return. Moreover, five years later, it delivered 168%.
So is it time to buy the Nasdaq 100 index or to wait for another dip before doing so?
All eyes are on the 12,000 level
Bulls should be worried about the 2022 declines, but as long as the market holds above the pivotal 12,000 level, the bias remains to the upside.
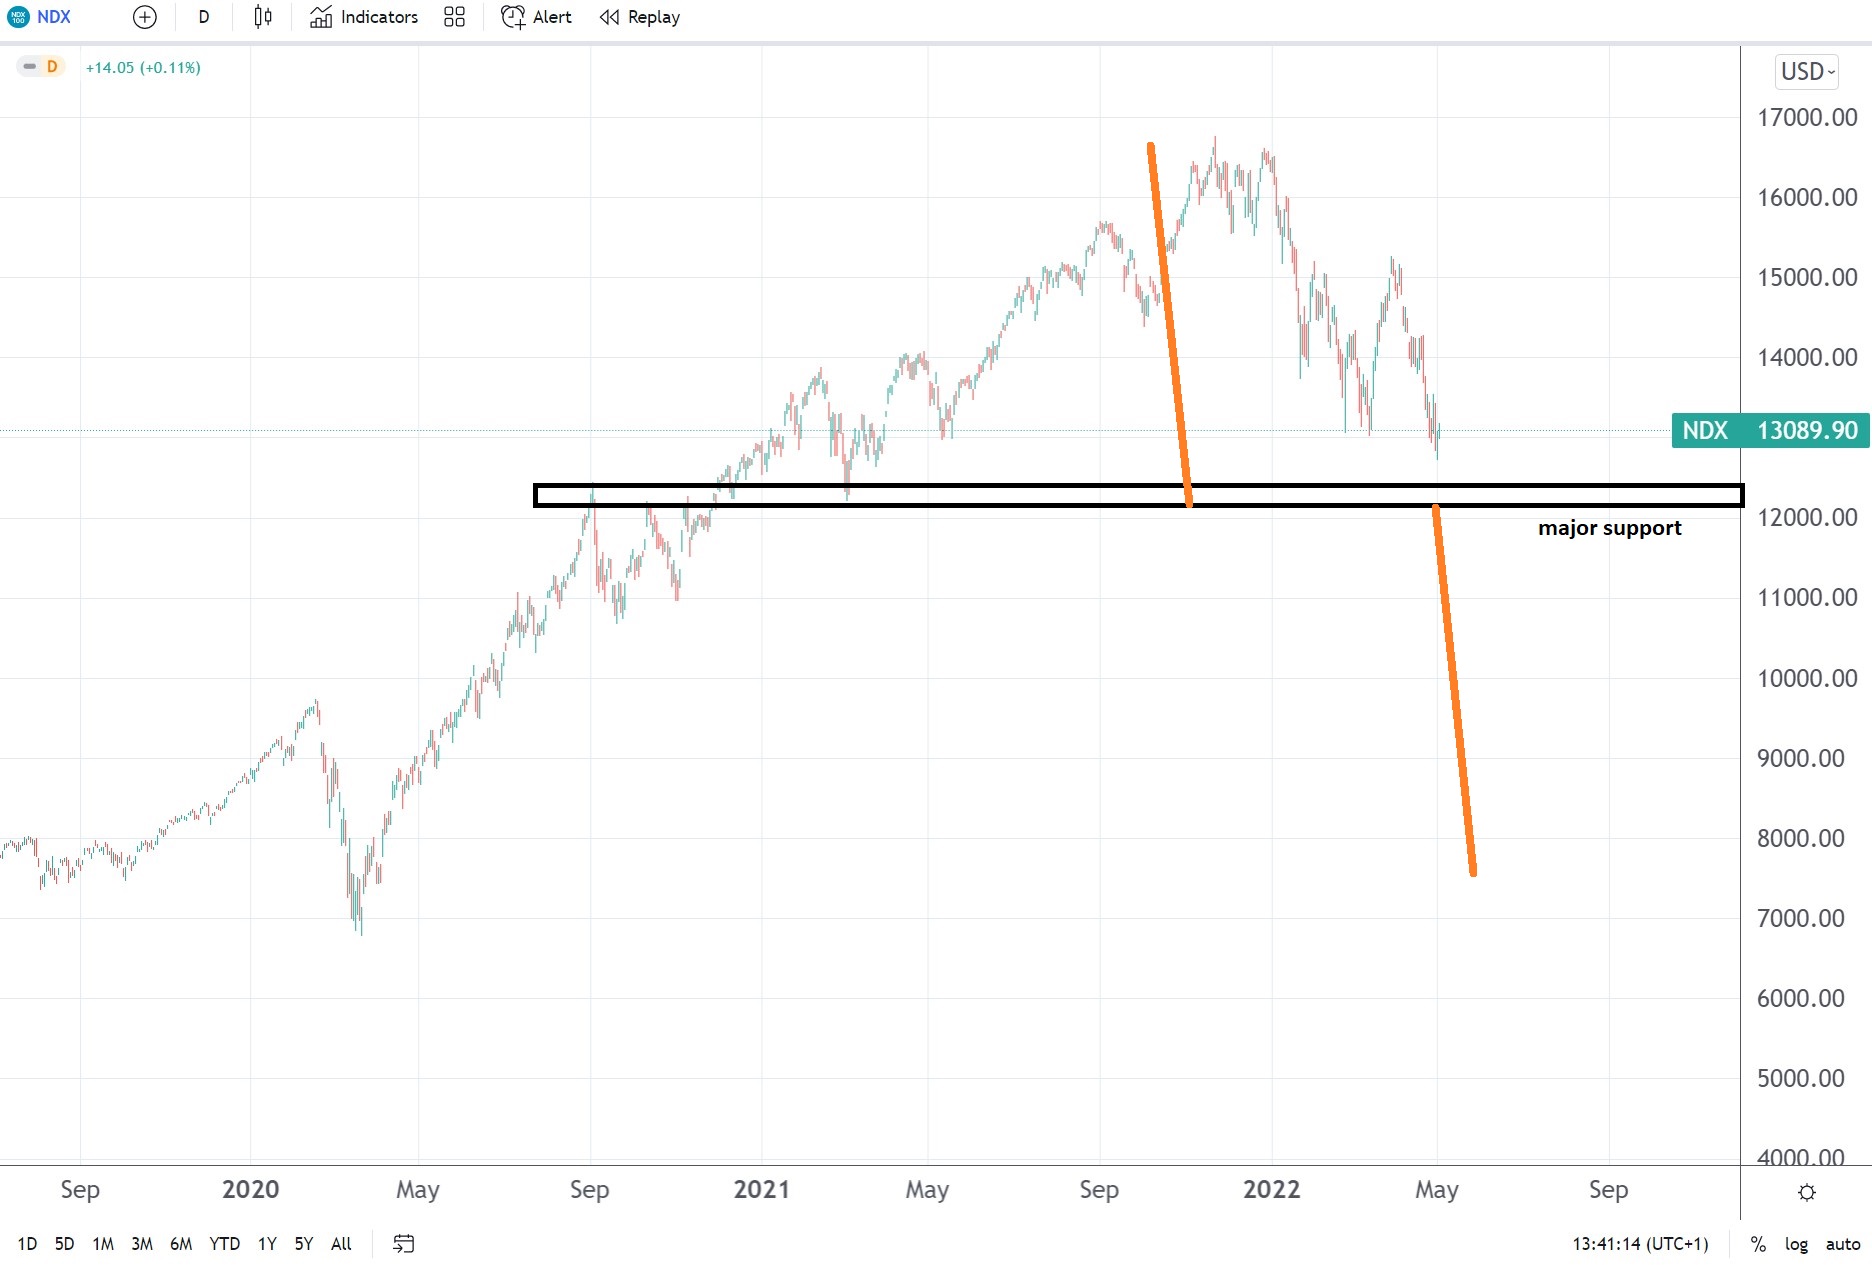
This is a level that acted as resistance in the past. When the index reached the 12,000 level for the first time, it hesitated for months before overcoming resistance.
As such, the level should act as a major support should the market drop that far. Hence, if bulls want to add to the long side, a drop to 12,000 might offer such an opportunity.
On the flip side, the pattern looks increasingly more bearish by the day. One may spot a possible head and shoulders pattern – a reversal pattern with a measured move pointing towards the 8,000 level.
Given the Fed’s hawkishness and the rate hikes already priced in, the stock market may have difficulty bouncing. However, considering the historical data, buying the dip might not be as bad as many investors think now.
