
At this week’s low, Microsoft stock was down more than 31.5% from its all-time high. That’s the worst decline in more than a decade.
The recent stock performance has been a tough pill for Microsoft Corporation (NASDAQ: MSFT) bulls to swallow.
Just a few months ago, Alphabet Inc (GOOGL) (GOOG), Microsoft and Apple Inc (NASDAQ: AAPL) were the relative strength leaders among megacap tech. They were the best of the bunch and withstanding the selling pressure quite well compared with peers.
Now, only Apple remains in that group (and is actually joined by Tesla Inc (NASDAQ: TSLA) at the moment).
Microsoft has reported mostly solid quarterly results and even just this week, it delivered a 10% dividend boost.
So far, though, it hasn’t mattered as Microsoft stock made new 52-week lows on Tuesday. Let’s look at the chart.
When to Buy Microsoft Stock
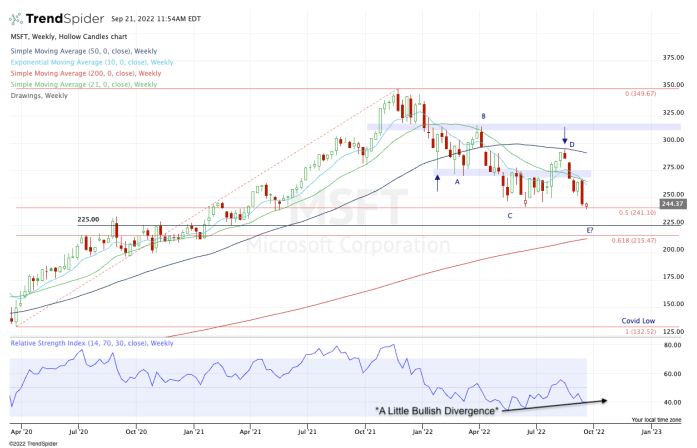
Weekly chart of Microsoft stock. Chart courtesy of TrendSpider.com.
I went back over the past 12 years, back to 2010. At that point, Microsoft had yet to break out over its dot-com-era high, yet most of its big pullbacks were in the 15% to 20% range.
Outside of those pullbacks, only two stand out: The 28% correction in 2010 and the 30.5% correction at the Covid lows in March 2020.
There’s just two pullbacks in excess of 30% – the covid correction and now.
At this week’s low, Microsoft stock was down 31.5% from the all-time high. So this type of correction is unusual, at least compared with the past dozen years.
While the pullback has been difficult, the levels now are clear.
The shares are currently teetering on the $240 level. That’s the 50% retracement from the all-time high down to the covid low in March 2020. It’s also where this year’s low came into play, in June.
If this level holds, I want to see how Microsoft does on a rebound to $250. Above that opens the door to the 10-week and 21-week moving averages in the low- to mid-$260s.
On the downside, a break and close below $240 could open the door down to the $215 to $225 area.
While that’s a wide range, volatility will be high and we need to be aware of key zones rather than down-to-the-penny levels.
In any regard, this $10-wide zone contains the 200-week moving average, the 61.8% retracement and the 2021 breakout level near $225.
For what it’s worth, the 161.8% downside extension of the current range (as measured from the “D” leg high down to the “C” leg low) comes into play around $210.
While that would put Microsoft stock down about 40% from the high, I think this is an area where long-term bulls are pushed to buy the stock rather than sell it, given how good of an asset this company is.
In that sense, it’s quite similar to the setup in Alphabet.
Source: If Microsoft Stock Support Fails, Here’s When to Buy.
